Critical minerals sit under almost every modern industrial policy story: EV batteries, grids, defense systems, and consumer electronics. But the bigger issue is not “do we have enough” in the ground—it’s who controls the parts of the chain that matter most when something goes wrong. In practice, concentration shows up as a short list of countries that set the pace on mining growth, and an even shorter list that dominates refining and processing. That can create hidden choke points: a weather event, a strike, an export rule, or a port disruption can ripple into prices and availability. This article breaks down what concentration looks like for lithium, cobalt, and nickel, why the pattern has persisted through 2010–2024, and how to read the risk through data (not vibes).
AI summary
- Mining vs Refining: Mining is concentrated, but refining is usually more concentrated—and often harder to diversify quickly.
- Uneven Leadership: Country leadership differs by mineral (lithium vs cobalt vs nickel), so “diversification” is not one policy move.
- Beyond Geology: Risk is not only geology: permitting timelines, processing know-how, and trade policy can matter more than reserves.
- Key Metrics: What to watch: top-three shares, single-country growth dependence, and whether new projects reach commercial scale.
Chart
Why critical minerals concentration matters now
Shock vectors in supply chains.
People often talk about critical minerals as if the only question is whether the world will “run out.” That’s not how supply shocks happen. The typical failure mode is concentration: a few producers supply most of the market, and a few refiners control the processing capacity that turns ore or brine into battery-grade material.
In 2024, the USGS and IEA both describe a world where output growth is heavily anchored in established producers—cobalt growth concentrated in Congo (Kinshasa) and Indonesia, nickel growth centered in Indonesia, and lithium expansion led by a handful of mining jurisdictions. That pattern increases exposure to disruption, and it can amplify price swings because spare capacity is limited.
If you want a quick “risk read,” focus on three questions: (1) How dominant are the top producers? (2) Is there a single country driving most new supply growth? (3) Is processing even more concentrated than mining? The IEA explicitly flags rising concentration in recent years, particularly in refining and processing.
Mining vs refining: two different bottlenecks
Where diversification fails.
Mining and refining are related, but they do not scale at the same speed. New mines often take years to permit, finance, and build. Refineries also take years, but they can be even more constrained by engineering know-how, environmental rules, and access to chemical inputs.
This is why a country can be a top miner without being a top refiner—and why downstream concentration can persist even if upstream mining diversifies slightly. The IEA’s framing is blunt: critical mineral markets have become more concentrated “particularly when it comes to refining and processing,” with most supply growth coming from the single top supplier for several minerals.
That matters for resilience. If you only secure mine supply but rely on a single refining hub, you can still face bottlenecks. In risk terms, diversification is not complete until it covers the stage that gates battery-grade material or alloy-ready inputs.
Chart: top producers by mineral in the latest year
USGS baseline figures for 2024.
This dataset uses USGS Mineral Commodity Summaries tables for world mine production by country. The latest year shown is the most recent year in those tables (2024 estimates where provided). It’s a practical way to see where mining concentration begins.
| Year | Mineral | Country | Production (tonnes) |
|---|---|---|---|
| 2024 | Lithium | Australia | 88000 |
| 2024 | Lithium | Chile | 49000 |
| 2024 | Lithium | China | 41000 |
| 2024 | Lithium | Zimbabwe | 22000 |
| 2024 | Lithium | Argentina | 18000 |
| 2024 | Cobalt | Congo (Kinshasa) | 220000 |
| 2024 | Cobalt | Indonesia | 28000 |
| 2024 | Cobalt | Russia | 8700 |
| 2024 | Cobalt | Canada | 4500 |
| 2024 | Cobalt | Australia | 3600 |
| 2024 | Nickel | Indonesia | 2200000 |
| 2024 | Nickel | Philippines | 330000 |
| 2024 | Nickel | Russia | 210000 |
| 2024 | Nickel | Canada | 190000 |
| 2024 | Nickel | China | 120000 |
Year,Mineral,Country,Production_tonnes\n2024,Lithium,Australia,88000\n2024,Lithium,Chile,49000\n2024,Lithium,China,41000\n2024,Lithium,Zimbabwe,22000\n2024,Lithium,Argentina,18000\n2024,Cobalt,Congo (Kinshasa),220000\n2024,Cobalt,Indonesia,28000\n2024,Cobalt,Russia,8700\n2024,Cobalt,Canada,4500\n2024,Cobalt,Australia,3600\n2024,Nickel,Indonesia,2200000\n2024,Nickel,Philippines,330000\n2024,Nickel,Russia,210000\n2024,Nickel,Canada,190000\n2024,Nickel,China,120000
Source: USGS Mineral Commodity Summaries
Lithium concentration: growth is broadening, but leaders still matter
Geology and geography.
Lithium is often described as “diversifying” because new projects appear across multiple continents. The USGS production table still shows a clear top tier: Australia, Chile, and China remain the dominant producers, with fast-moving growth nodes like Argentina and Zimbabwe. Even if the long tail expands, the leaders shape market balance because their incremental capacity is large relative to total supply.
Another subtle point: the geology types differ (hard-rock spodumene vs brines vs clays), which affects processing routes and timelines. That makes quick substitution difficult if a specific route hits constraints. The practical implication is that supply security strategies should track not only country shares, but also processing pathway concentration.
Cobalt concentration: a single-country story with real shock risk
The single point of failure.
Cobalt is the clearest illustration of concentration risk. In the latest USGS table, Congo (Kinshasa) accounts for the majority of mined cobalt, and the USGS narrative explicitly notes it as the world’s leading source of mined cobalt. That kind of structure creates a classic single-point-of-failure problem: labor unrest, policy changes, conflict risk, or logistics constraints can move the whole market.
At the same time, battery chemistry is shifting. Some cathode chemistries reduce cobalt intensity, and lithium iron phosphate (LFP) avoids cobalt entirely. That helps on the demand side, but it does not remove cobalt’s importance for other applications (like superalloys) or for certain high-energy battery designs.
From a supply-chain perspective, the smartest way to talk about cobalt is not “replace it,” but “reduce exposure”: diversify feedstock sources, expand recycling, and make processing less geographically concentrated over time.
Nickel concentration: Indonesia’s dominance reshaped the market
Industrial policy in action.
Nickel is a good reminder that concentration can change fast—just not always in the direction you want. The USGS data shows Indonesia producing far more mined nickel than any other country. This reflects not only geology but also industrial policy, investment, and processing build-out tied to stainless steel and battery supply chains.
But “more supply” does not automatically mean “less risk.” When one country becomes the swing producer, policy or permitting changes inside that country can echo globally. You also have product-form complexity in nickel (Class I vs Class II forms, intermediates like mixed hydroxide precipitate), which can create bottlenecks between mine output and battery-grade inputs.
If you track nickel risk, watch two things: (1) whether new supply is largely one-country dependent, and (2) whether downstream refining capacity is even more concentrated than mining.
Chart: supply concentration trend using top-three shares
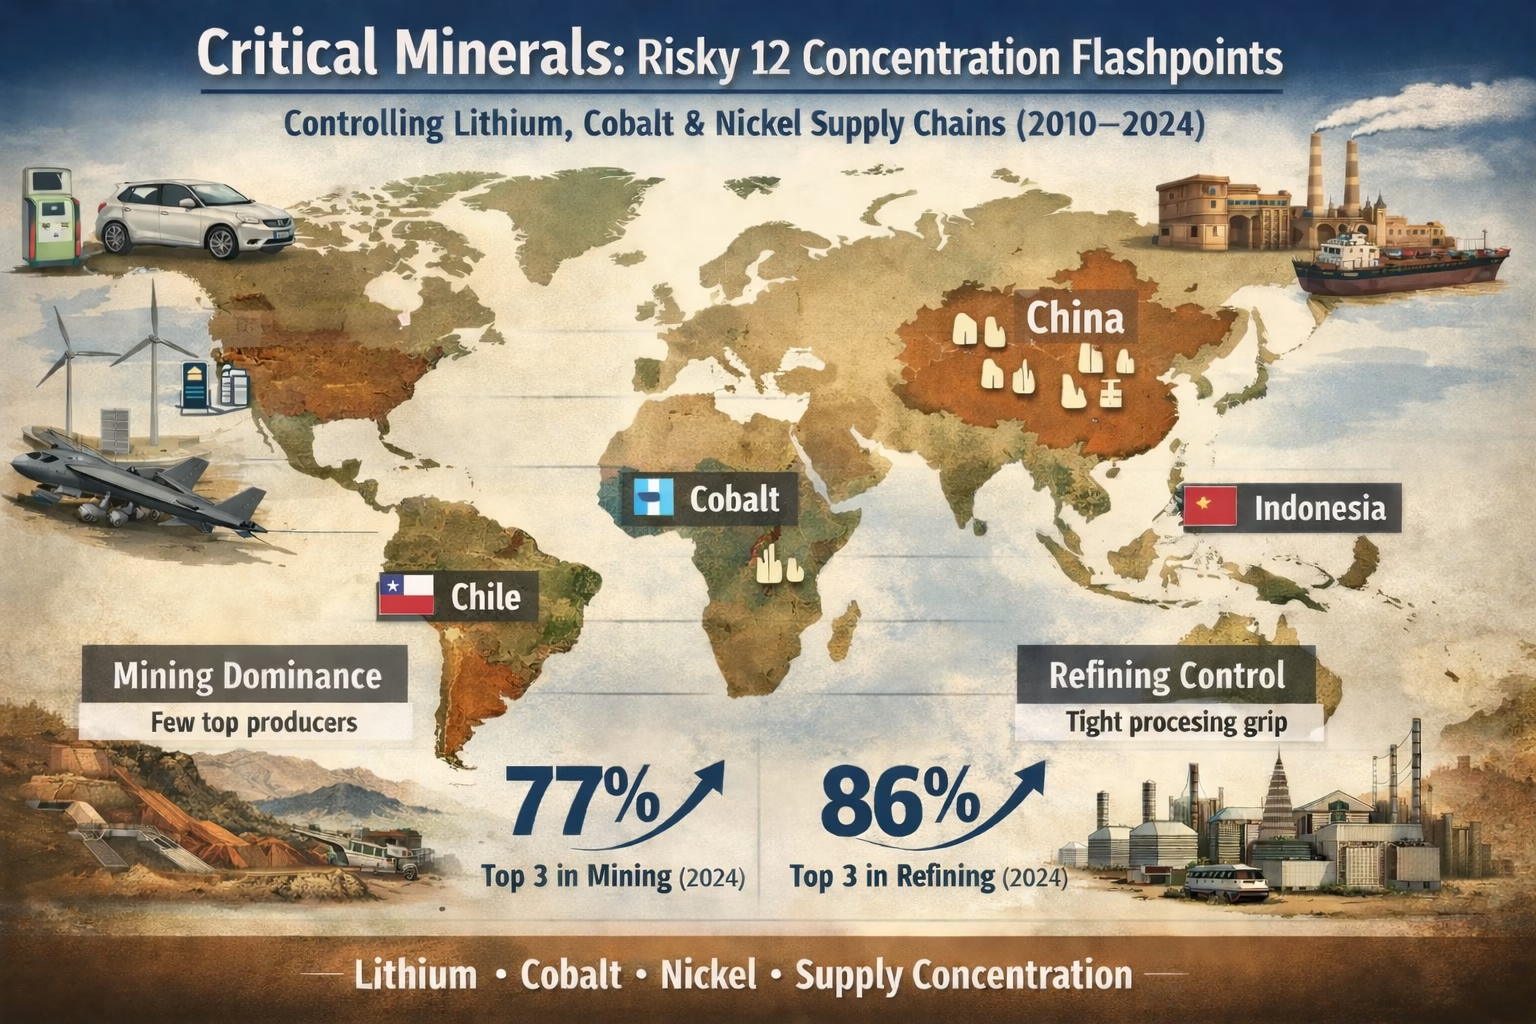
The IEA view of increasing risks.
The IEA publishes concentration metrics that summarize how much of supply is controlled by the top three countries. For a compact trend view, the IEA notes that the average market share of the top three mining countries for key energy minerals rose from 73% in 2020 to 77% in 2024. For refining, the IEA also highlights concentration increasing from around 82% in 2020 to 86% in 2024 for key minerals.
Important limitation: A consistent, comparable IEA time series back to 2010 is not presented in the same simple top-three-share format in these summary pages. So this chart intentionally uses the clean 2020→2024 endpoints and treats 2010–2019 as a contextual period discussed qualitatively in the text.
| Year | Segment | Top 3 Share (%) |
|---|---|---|
| 2020 | Mining (avg key minerals) | 73 |
| 2024 | Mining (avg key minerals) | 77 |
| 2020 | Refining (avg key minerals) | 82 |
| 2024 | Refining (avg key minerals) | 86 |
Year,Segment,Top3_share_percent\n2020,Mining (avg key minerals),73\n2024,Mining (avg key minerals),77\n2020,Refining (avg key minerals),82\n2024,Refining (avg key minerals),86
Source: IEA Global Critical Minerals Outlook 2025
What actually drives concentration from 2010 to 2024
The structural reality of mining.
When you step back across 2010–2024, concentration tends to persist for reasons that are boring but powerful: project lead times, capital costs, permitting risk, and processing complexity. Even if exploration finds new deposits, those deposits do not become market-shaping supply quickly.
On top of that, industrial policy matters. Export restrictions, local processing mandates, and large-scale infrastructure build-outs can shift where investment goes. The result is that concentration can either harden (if one jurisdiction becomes the default investment destination) or migrate (if growth moves from one region to another), without necessarily declining.
Trade and development institutions also emphasize that value addition is often uneven: many producing countries export lower-value materials while higher-value refining and manufacturing concentrate elsewhere. UNCTAD’s work on critical minerals repeatedly returns to this theme—who captures value along the chain, and how to build fairer, more resilient value chains.
Analysis
Tracking resilience metrics.
From what I see in the data, the most useful takeaway is simple: concentration is not a talking point—it’s a measurable structure that can be monitored like any other risk indicator. The USGS tables show how quickly a “top producer” becomes a dominant producer (nickel is the clearest case), and the IEA top-three shares show that, on average, concentration has increased in both mining and refining between 2020 and 2024.
Our analysis suggests that the highest-return mitigation is not chasing every new deposit. It’s targeting the tightest bottleneck in your own exposure: if you depend on nickel intermediates, focus on the form and the refineries; if you depend on cobalt, prioritize diversification and recycling pathways that reduce single-country dependence; if you depend on lithium, track processing routes and conversion capacity, not only mine output.
One caveat: these charts do not prove causality, and they do not capture every dimension of resilience (inventory buffers, contract terms, or the difference between nameplate capacity and real throughput). They also simplify a complex chain into country-level metrics. I’d treat them as a dashboard—not a verdict.
How to use this framework in procurement and policy
Actionable steps for risk mitigation.
- Measure exposure: map each input to both its mining origin and its refining origin. The second is often the surprise.
- Track top-three share: rising top-three share is an early warning that shocks will transmit faster.
- Watch incremental supply: if one country supplies most of the new growth, future bargaining power concentrates even if today’s shares look “ok.”
- Don’t ignore recycling: it is one of the few ways to add supply without new mines, and it can reduce import dependence.
- Design for substitution: where feasible, build flexibility into chemistries and specifications so you are not locked to a single input form.
If you want a fast internal audit, start by documenting which of your products rely on lithium, cobalt, or nickel inputs, then list the top two countries you depend on for each stage (mining and refining). That single page often reveals where resilience work should begin.
FAQ
Quick answers to common questions.
- What does supply concentration mean for critical minerals?
It means a small number of countries control a large share of mining or refining, increasing disruption and price risk. - Which critical minerals are most concentrated today?
Cobalt mining is highly concentrated, while refining for many minerals is even more concentrated than mining. - Is mining concentration the same as refining concentration?
No. Refining and processing often concentrate more because capacity is harder to build and relies on specialized know-how. - Who leads lithium mine production in the latest USGS data?
Australia is the largest lithium producer in the USGS Mineral Commodity Summaries table for the latest year shown. - Why is cobalt considered a high-risk mineral?
Because most mined cobalt comes from one country, which creates a single-point-of-failure risk for global supply. - Why did nickel concentration change so fast?
Industrial policy and investment scaled production quickly in Indonesia, making it the dominant global producer in the latest USGS table. - How can companies reduce critical minerals supply risk?
Use dual-sourcing, track refining origin, build recycling inputs, and design specs that allow substitution where possible. - Do EV batteries always require cobalt and nickel?
No. Some chemistries like LFP reduce or avoid cobalt and nickel, but other applications still rely on them. - What is a practical metric to monitor concentration?
Top-three share (the market share of the three largest countries) is a common and readable concentration metric. - Why is 2010–2019 harder to chart consistently?
Public summary pages often provide clean endpoint comparisons (e.g., 2020 vs 2024) rather than a uniform annual series back to 2010.
Hashtags
Copy-paste friendly.
#CriticalMinerals #Lithium #Cobalt #Nickel #SupplyConcentration #EnergyTransition #BatteryMaterials #SupplyChainRisk #MineralSecurity #Mining #Refining #IndustrialPolicy #Geopolitics #Recycling
Sources
Primary datasets and references.
Short audio version of the blog:
Watch Video Below:
Made with NoteBookLM

Discover more from ThePolymathPursuit
Subscribe to get the latest posts sent to your email.
Anyone else having trouble with the f12betlogin? Keeps saying wrong password even though I’m sure it’s correct. Is this normal? Click through here: f12betlogin
Looking for a Betão Betano signup guide. It seemed pretty straightforward but I want to be completely sure before signing up! Click here to investigate: betão betano
Decided to give n66bet a shot. Wish me luck! Hopefully, lady luck is on my side tonight. Fingers crossed! n66bet