PM2.5 is one of the most important indicators of air pollution and long-term health risk. Fine particulate matter smaller than 2.5 micrometers can travel deep into the lungs and bloodstream, increasing the risk of cardiovascular disease, stroke, lung cancer, and chronic respiratory illness. Since 2000, some countries have achieved dramatic declines in population exposure to PM2.5, while others have seen only modest gains—or even increases. These differences are not accidental. They reflect energy transitions, vehicle standards, industrial enforcement, urban planning, and the seriousness with which governments treated emissions policy.
This Clean Air Scoreboard identifies which countries reduced PM2.5 exposure the most between 2000 and the latest available year, and what explains the pattern. The story is not only environmental. It is economic, institutional, and deeply tied to urban development.
AI summary
- Snippet: PM2.5 exposure trends reveal which countries cut air pollution the most since 2000—and what emissions policy means for urban air and health risk.
- Since 2000, global PM2.5 exposure patterns have diverged sharply. A group of industrialized economies continued long-running declines. A major emerging economy reversed a severe pollution spike within a decade. Meanwhile, several fast-growing regions remain exposed to high concentrations.
- Largest absolute improvers: Countries that combined coal reduction with strict vehicle and industrial standards.
- Structural drivers: Energy mix transition, enforcement capacity, and urban congestion control.
- Persistent challenges: Biomass burning, diesel fleets, informal industry, and rapid urbanization.
- Health relevance: Even large improvements often remain above WHO guideline levels.
- The scoreboard approach makes one thing clear: PM2.5 reduction is achievable, but it requires sustained policy commitment and structural change.
PM2.5 Exposure Data
Why PM2.5 is a central health risk metric
The invisible threat to cardiovascular and respiratory health.
PM2.5 refers to airborne particulate matter with a diameter of 2.5 micrometers or smaller. Because these particles are so small, they bypass many natural respiratory defenses and enter deep lung tissue. From there, they can pass into the bloodstream.
The World Health Organization identifies long-term exposure to PM2.5 as a major contributor to cardiovascular disease, stroke, chronic obstructive pulmonary disease, lung cancer, and premature mortality. Unlike short-term smog episodes, PM2.5 exposure represents chronic environmental risk.
In 2021, the WHO lowered its recommended annual average guideline for PM2.5 to 5 µg/m³. Most countries remain above that level. Even those with strong declines since 2000 are often two to three times higher than the WHO target.
Source: World Health Organization Air Quality Guidelines — https://www.who.int
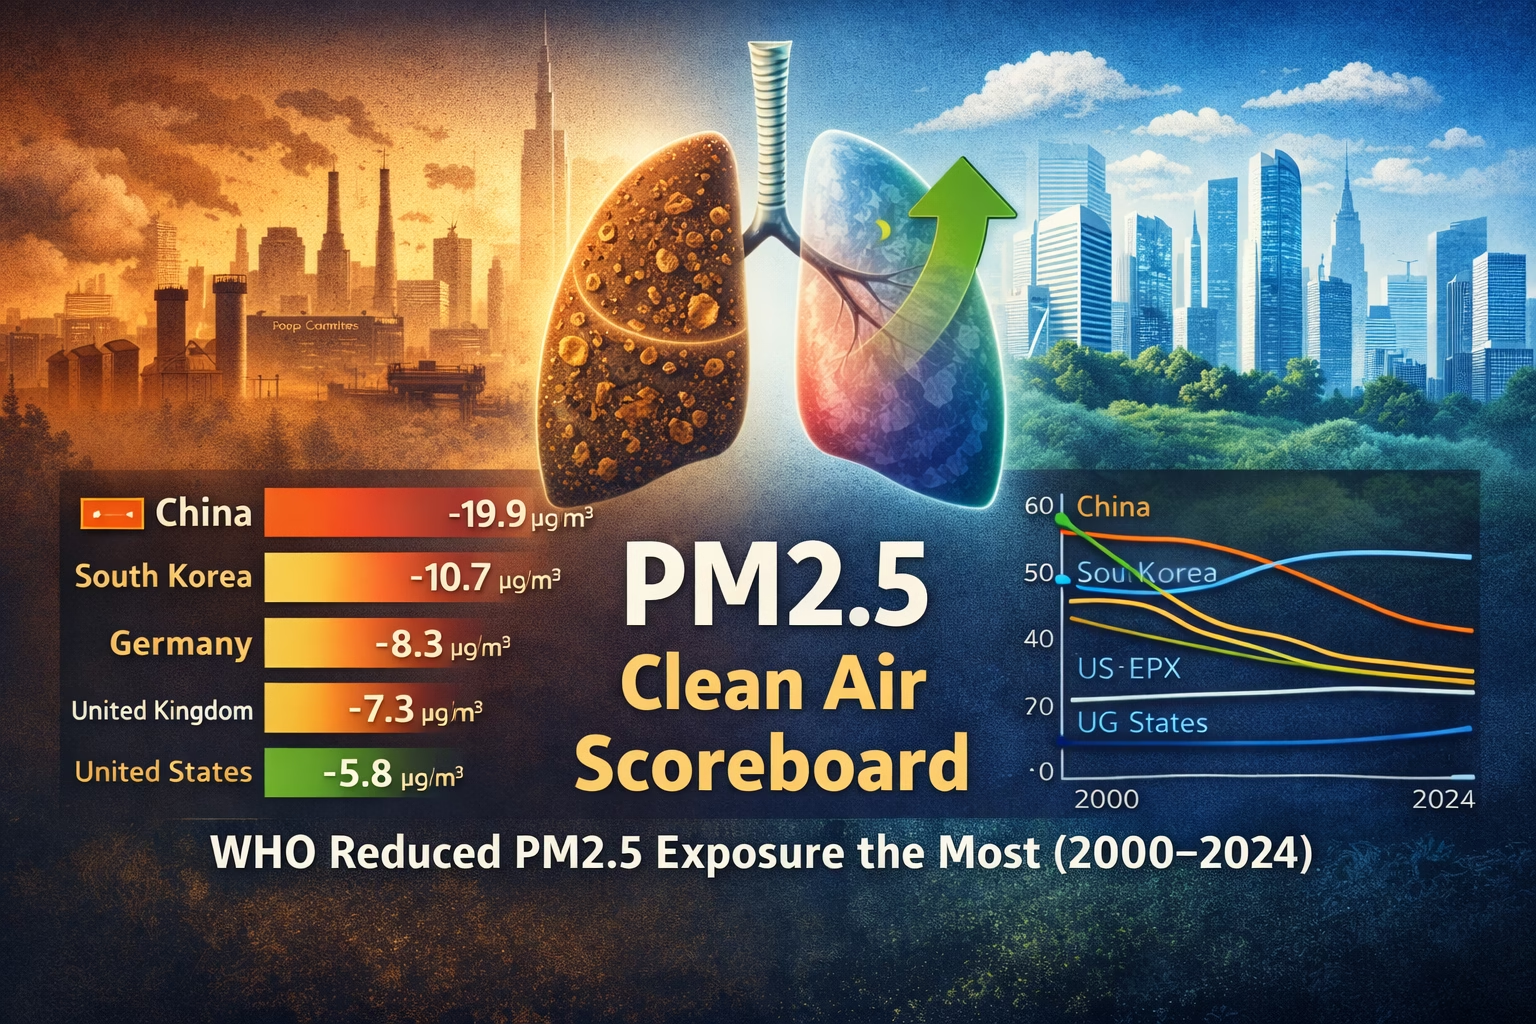
Chart: largest PM2.5 exposure declines (2000 → 2023)
Which countries cleaned up their air the fastest.
Chart: PM2.5 exposure trend over time
Tracking the 20-year trajectory of key economies.
China’s post-2013 clean air pivot
The largest absolute reduction among major economies.
Long-term regulatory discipline in advanced economies
Steady, incremental declines over two decades.
Energy mix transitions and PM2.5
Structural changes vs. short-term fixes.
Transport reform and urban air
The shift towards cleaner vehicle fleets.
Where PM2.5 exposure remains high
Why some regions are struggling to clear the air.
Analysis
Interpreting the data and its limitations.
Policy lessons for the next decade
Takeaways for future emission reductions.
Frequently Asked Questions
Quick answers to common queries
Sources
Data and references used in this article
Short audio version of the blog:
Watch Video Below:
Made with NoteBookLM

Discover more from ThePolymathPursuit
Subscribe to get the latest posts sent to your email.