Tourism recovery is no longer a question of “are we back?”—it’s “what did travel become after the shock?” The post-pandemic rebound is real, but uneven: arrivals climbed close to pre-2019 levels by 2024, receipts moved faster than volumes in many places, and the cost experience changed as air capacity, labor, and accommodation prices reset. The practical result is a new travel map: some destinations are winning on value, some on connectivity, and some on premium pricing. In this guide, I’ll anchor the story in UN Tourism’s global totals for arrivals and receipts from 2019 onward, then translate those totals into decisions: where costs come from, what “value for money” means in 2025, and how travelers and planners can avoid confusing a rebound with a return to the old normal.
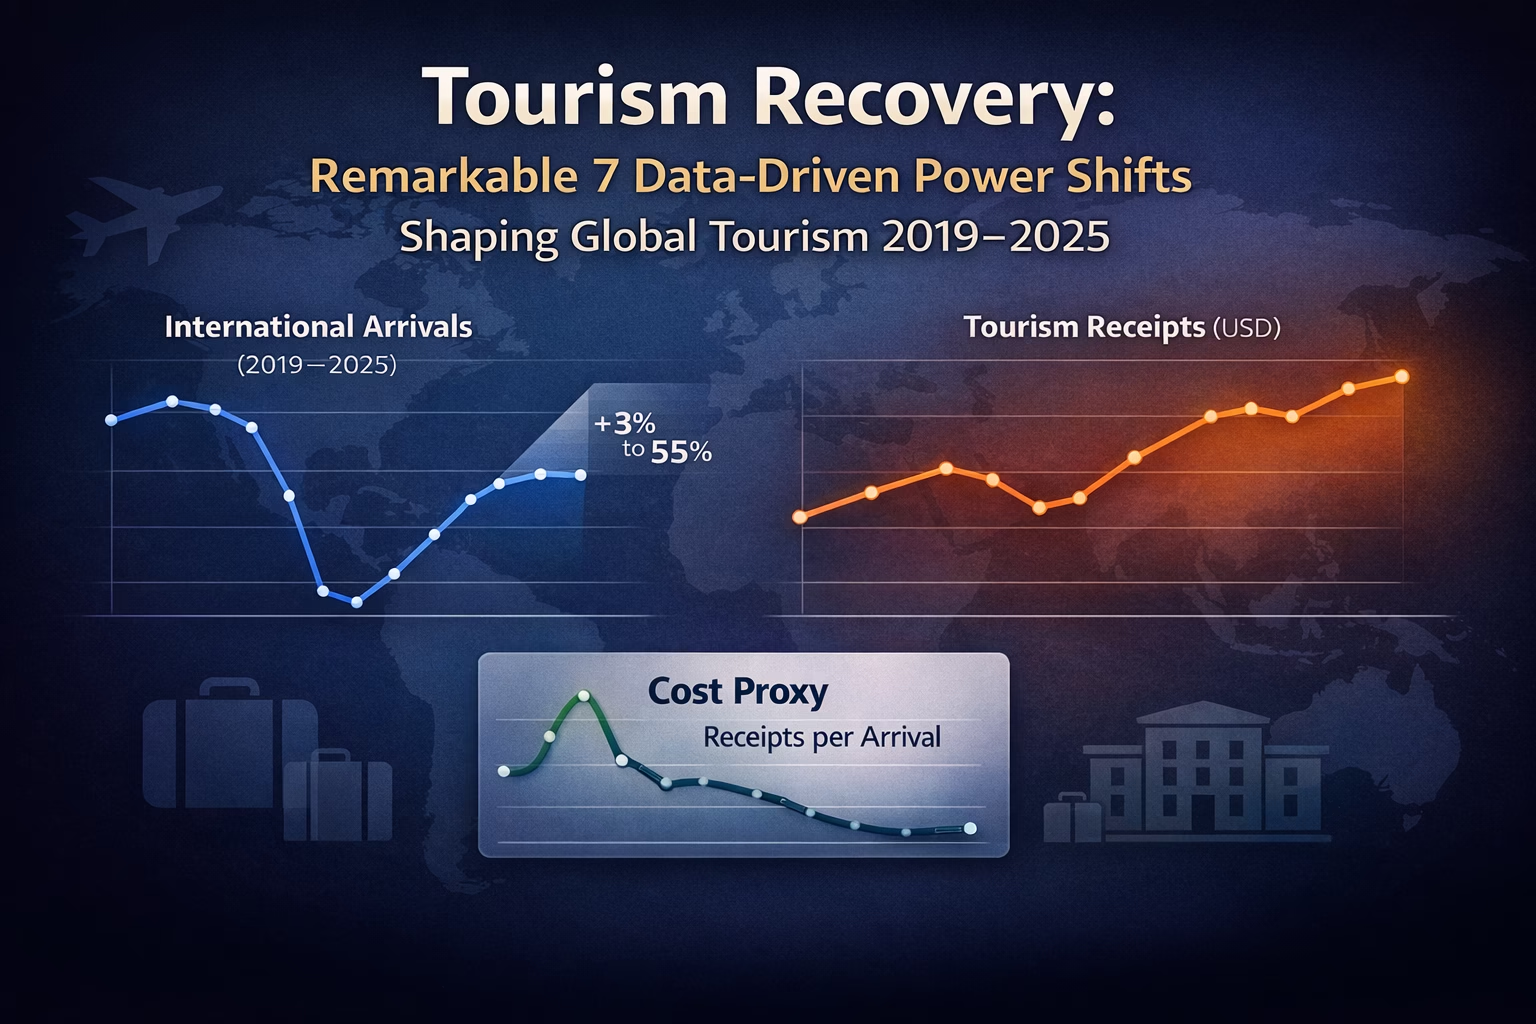
Datasets included below (copy-paste ready): Global international tourist arrivals (2019–2024 + 2025 growth range), global tourism receipts (2019–2024), and receipts per arrival as a cost proxy (2019–2024), all sourced from UN Tourism’s World Tourism Barometer (January 2025 excerpt).
AI summary
Snippet: Tourism recovery is reshaping travel: arrivals, receipts, and costs from 2019–2025 with UN Tourism data, what changed, and what to watch next.
What you’ll get in this article:
- A clean, global scoreboard for tourism recovery: arrivals (volume), receipts (value), and receipts-per-arrival (a practical “cost proxy”).
- Three chart-ready datasets you can paste directly into your visualization workflow.
- A simple way to interpret 2025: UN Tourism’s expected growth range, plus the main risks that could shift outcomes.
Tourism Recovery Data
Why tourism recovery after 2019 looks different than most rebounds
The travel chain broke, and it didn’t reconnect in the same shape.
Tourism is not a single market. It’s a chain: airlines and seat capacity, visas and border policy, hotel supply, local labor, currency swings, and travelers’ willingness to pay. When the pandemic disrupted that chain, it didn’t snap and reconnect in the same shape. Some pieces came back quickly (short-haul and regional travel), while others lagged (certain long-haul routes, some inbound markets, and capacity-constrained corridors).
That’s why a “recovery index” needs more than one number. Volume (arrivals) can recover while value (receipts) jumps ahead—especially when prices rise or when the traveler mix shifts toward higher spend. And costs can feel high even when volume looks normal, because spending per arrival stays elevated compared to the pre-pandemic baseline.
UN Tourism’s 2019–2024 totals show the broad pattern: 2024 sits close to 2019 in arrivals while receipts are already strong. The key question for 2025 is not “will travel grow?”—the outlook already points to continued growth—but how that growth is distributed, and what it costs travelers to participate.
Global international arrivals: the cleanest tourism recovery volume signal
Measuring the raw number of people moving across borders.
Tourism receipts: the value side of tourism recovery
Volume tells you “how many,” receipts tell you “how much.”
A practical travel cost proxy: receipts per arrival
How much money is captured per international trip.
Where the recovery is strongest and what that means for travelers
Navigating tradeoffs between capacity, value, and crowding.
What’s driving the travel cost index feeling in 2024–2025
Why the post-pandemic pinch is still a reality.
How to use this tourism recovery index for planning and decisions
Reading demand, cash outcomes, and cost heat.
What to watch next in 2025: growth range, risks, and the value-for-money test
Expectations for the year ahead.
Analysis
A shift in how travel converts into money.
Frequently Asked Questions
Quick answers to common queries
Sources
Data and references used in this article
Short audio version of the blog:
Watch Video Below:
Made with NoteBookLM

Discover more from ThePolymathPursuit
Subscribe to get the latest posts sent to your email.