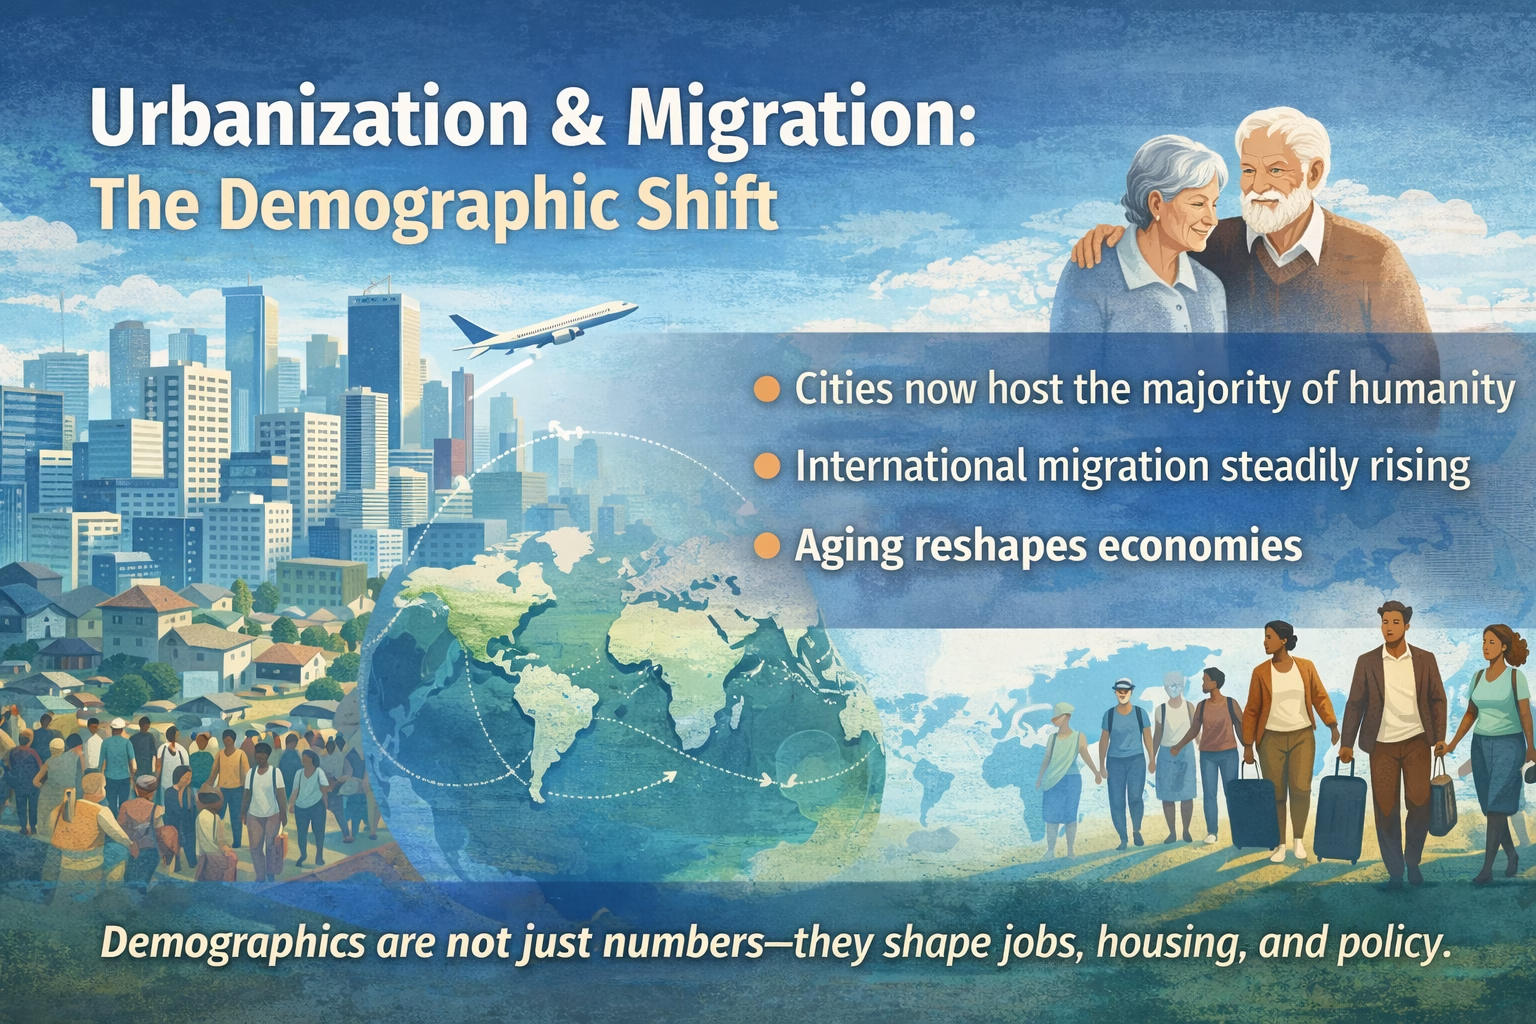
Since 1990, the world has become more urban and more mobile, while aging and fertility shifts are changing what countries need from housing, labor markets, and public services.
AI summary
- Urban Shift: Since 1990, urbanization has been persistent and structural, driven by economic reallocation rather than just population growth.
- Migration Reality: While raw migrant numbers have risen (281M in 2020), they remain a small share of the global population (3.6%), heavily concentrated in specific hubs.
- Demographic Collision: The convergence of aging populations, lower fertility, and urban growth is creating acute pressure on housing, healthcare, and infrastructure.
Chart
What changed most in global demographics since 1990
Speed and unevenness define the era.
Urbanization and migration are often discussed as separate issues, but they increasingly move together. As cities grow, they pull in workers and students from rural areas and across borders. At the same time, aging populations and falling fertility rates are reshaping the demand for housing, healthcare, transport, and jobs.
The big story since 1990 is not just “more people in cities” or “more people moving.” It is the speed of change and how uneven it is. Some regions are still adding young workers and building new urban infrastructure at scale. Others are trying to keep services running with a shrinking workforce and a rising share of older residents.
This guide breaks down what is happening, what the data can and cannot prove, and where policy choices matter most. It also includes copy-paste chart datasets you can use immediately for visuals.
How to read demographic change without getting misled
Avoid oversimplification.
Demographic change is easy to oversimplify. “Population growth” can hide the fact that two countries with the same population size may face completely different realities if one is young and rural while the other is older and urban. In practice, planners care about age structure, household size, where people live, and whether people can move for work.
Three framing points help keep this grounded:
- Urbanization is a reallocation problem. People and capital concentrate in cities. That changes land use, transport needs, and labor markets.
- Migration is a timing and skills problem. Migration can ease labor shortages, but it also raises demand for housing and services in destination areas.
- Aging is a ratio problem. What matters is how many working-age people support each older adult, and how quickly that ratio changes.
When you see a headline about “record migration” or “rapid urban growth,” it helps to ask: is this a short-term surge, a long-run trend, or a statistical update? UN DESA estimates are the baseline reference for international migrant stock, and they are updated on a schedule. Likewise, urbanization metrics differ depending on country definitions, so using a harmonized source (like the World Bank’s compiled series) is often the safest approach for comparisons.
Urbanization accelerated, and cities became the main stage
A persistent structural shift.
Since the mid-1990s, the world has steadily shifted toward cities. The key point is that urbanization is persistent: it tends to move in one direction over long spans, even when economic cycles wobble. That is why housing affordability, transport networks, and basic urban services have become structural policy issues rather than short-term projects.
At the global level, the urban share of population has risen year by year. The World Bank’s urban population share series shows the upward slope clearly across decades. The dataset below is trimmed to a compact set of years so it can be charted quickly.
| Year | Urban population (% of total) |
|---|---|
| 1995 | 45.691 |
| 2000 | 46.694 |
| 2005 | 48.627 |
| 2010 | 51.556 |
| 2015 | 54.122 |
| 2020 | 56.150 |
| 2021 | 56.489 |
Year,Urban population (% of total)\n1995,45.691\n2000,46.694\n2005,48.627\n2010,51.556\n2015,54.122\n2020,56.150\n2021,56.489
What this trend means on the ground:
- Housing becomes the bottleneck. When urban population grows faster than housing supply, prices and rents rise, informal settlements expand, and commuting distances increase.
- Infrastructure needs shift from “build once” to “operate forever.” Water systems, electricity networks, and transit need long-run maintenance capacity.
- Urban labor markets become more specialized. Cities concentrate higher-productivity jobs, but they also create service-sector demand that attracts lower-wage work.
International migration rose, but the share of the world stayed small
More people moving, but not everywhere.
Migration is often perceived as “exploding,” but the more accurate description is: the number of international migrants has increased over decades, while the share of migrants in the world population has grown modestly. Both can be true at once. A larger world population and a larger migrant stock can coexist without migrants becoming a dominant share everywhere.
UN DESA’s International Migration 2020 highlights provide clear global reference points: about 173 million international migrants in 2000, 221 million in 2010, and 281 million in 2020. The same UN summary notes that international migrants are about 3.6% of the world’s population in 2020.
| Year | International migrant stock (million) |
|---|---|
| 2000 | 173 |
| 2010 | 221 |
| 2020 | 281 |
Year,International migrant stock (million)\n2000,173\n2010,221\n2020,281
How to interpret the rise:
- Stocks are not flows. Migrant stock counts people living outside their birth country; it does not tell you how many moved in a single year.
- Crises change routes faster than totals. Conflicts and sudden economic shocks can redirect flows, but global totals usually change gradually.
- Destinations concentrate. A smaller number of high-income destinations host large shares of migrants, which is why political attention can feel outsized even when global shares remain modest.
Urbanization and migration collide with aging and low fertility
The two-track challenge.
The demographic story is not only about where people live or whether they move. It is also about age. Many countries now face a two-track challenge: their cities need housing and infrastructure for growing populations, while their overall population is aging and the working-age share is shrinking.
Aging changes the math of public finance and labor supply. As the share of older people rises, demand increases for healthcare, long-term care, and age-friendly housing. At the same time, the tax base can weaken if labor force growth slows. This is why “dependency ratios” matter more than headline population totals.
What this means for city planning:
- Smaller households increase housing demand. Even if population growth slows, the number of households can keep rising if average household size falls.
- Healthcare access becomes a spatial problem. Older populations need nearby clinics, reliable transport, and safe walkable neighborhoods.
- Infrastructure must handle both growth and adaptation. Cities expanding outward still have to retrofit older districts for accessibility and heat resilience.
What policymakers can do when demographics move faster than systems
Bridging the gap.
Most demographic pressures are slow-moving, which is good news: governments can prepare if they treat the trends as structural. The bad news is that many systems—housing approvals, transit expansion, health workforce training—move even slower. That gap is where problems build up.
Five actions show up repeatedly in places that manage demographic change well:
- Build housing capacity where jobs are. That means zoning reform, faster approvals, and transport links that open new land to development.
- Invest in “connective” infrastructure. Transit, water, and power networks reduce the penalty of urban growth and improve productivity.
- Plan migration with local capacity in mind. National targets should be paired with city-level housing and service capacity plans.
- Adapt for aging early. Workforce pipelines for care jobs, preventive health, and age-friendly urban design reduce future costs.
- Use data as an operating tool. Update household projections, not just population projections, and track housing completions versus demand.
FAQ
Quick answers to common questions.
- What is the difference between urbanization and city growth?
Urbanization is the rising share of people living in urban areas; city growth is the increase in city population, which can happen even if the urban share is stable. - Does more migration always mean faster economic growth?
No. Benefits depend on labor demand, housing supply, integration policy, and worker protections. - Why do migrant “stock” numbers matter?
They show how many people live outside their birth country at a point in time, which affects services, housing, and labor markets. - Can migration offset aging populations?
It can ease near-term shortages, but it usually cannot fully offset aging on its own, and migrants also age over time. - Why is housing central to demographic change?
Because urban growth and migration concentrate demand in specific places, and housing supply often responds slowly. - Are global migration shares large?
UN DESA estimates put international migrants at about 3.6% of the world population in 2020—small globally, but concentrated in specific destinations. - How should I interpret urban population percentage data?
As a long-run indicator of where people live; country definitions vary, so consistent sources help comparison. - What are the biggest risks of rapid urbanization?
Housing shortages, informal settlements, congestion, and underfunded infrastructure maintenance. - What policies improve migration outcomes for cities?
Housing supply expansion, credential recognition, language support, and pathways into formal work. - What is the most practical takeaway for planners?
Track households, not just population, and align migration and urban plans with housing and service capacity.
Hashtags
Copy-paste friendly.
#DemographicChange #Urbanization #Migration #PopulationTrends #Cities #Housing #AgingPopulations #FertilityRates #UrbanPlanning #LaborMarkets #Infrastructure #UNdata #WorldBankData
Sources
Primary datasets and references.

Discover more from ThePolymathPursuit
Subscribe to get the latest posts sent to your email.
Mass comment blasting: $10 for 100k comments. All from unique blog domains, zero duplicates. I will provide a full report and guarantee Ahrefs picks them up. Email mailto:helloboy1979@gmail.com for payment info.If you received this, you know Ive got the skills.
Okay, 777casino is pretty legit. Good selection of games and I haven’t had any issues. Give it a spin if you’re looking for a new spot. 777casino
Hey, checking out the 2ez betting hub! Looks like a solid spot to get your bets in. Good odds and a decent community vibe! Definitely worth a peek. Check it out here 2ez betting hub
Alright guys, heard about phswerteph. Seems promising. I’ll take a gamble haha. You also wanna try? phswerteph
wish you all the best
Very good i like it
每天都在战争,希望2026和平.
A really good blog and me back again.