Summary
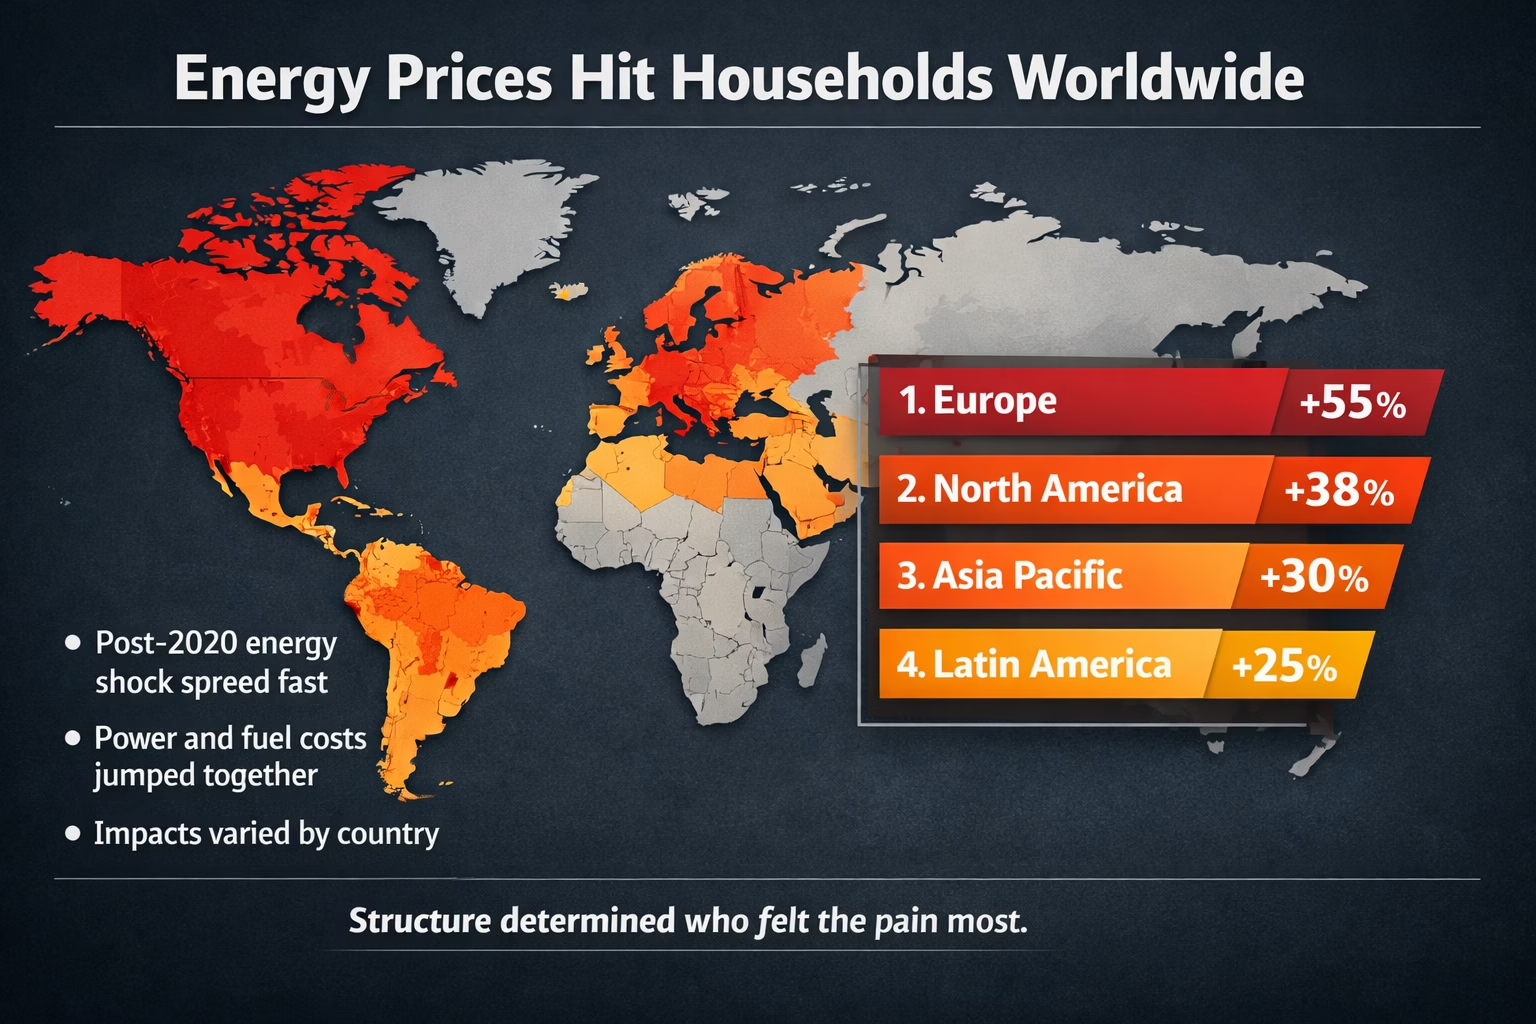
Since 2020, energy prices have been one of the fastest-moving forces behind the cost-of-living squeeze. The shock did not land evenly. Some countries saw brief spikes and quick relief. Others absorbed sustained pressure that filtered into food, transport, and rent.
This piece compares where the hit was hardest, why outcomes diverged, and what policies softened — or amplified — the blow.
- Energy prices rose sharply after 2020, then diverged by region.
- Import dependence and market design mattered more than headline prices.
- Household support reduced pain, but often at fiscal cost.
- The after-effects still shape inflation today.
Energy prices since 2020
Global energy markets tightened quickly after 2020. Gas prices led the move, pulling electricity prices with them in many countries. The peak was dramatic, but what followed was more revealing.
Some markets normalized within months. Others stayed elevated longer — not forever, but long enough to change budgets and politics.
- Gas-linked power markets saw the biggest swings.
- Regulated tariffs delayed, rather than removed, the impact.
How energy fed into inflation
Energy rarely stays in the energy bill. Higher fuel and power costs feed into food processing, freight, and services. The speed of this pass-through varied, but the direction was consistent.
Where energy is a larger share of household spending, the effect felt sharper. It’s simple maths, and it stings.
- Transport and food prices reacted fastest.
- Wage adjustments lagged price increases.
Why countries felt it differently
The biggest differences came down to structure. Import dependence, storage, market rules, and fiscal space shaped outcomes more than the initial shock itself.
Some governments absorbed costs centrally. Others passed them through. Neither choice is painless — just painful in different places.
- High import reliance amplified volatility.
- Subsidies cushioned households but raised public debt.
Policy moves: caps, subsidies, and rebates
When bills jumped, many governments reached for the same toolbox: price caps, bill credits, fuel tax cuts, and cash transfers. It helped people breathe. But there’s a catch. Someone still pays — via budgets, utility balance sheets, or delayed price resets later.
Timing mattered. Fast support reduced the initial spike in consumer inflation. Slow or partial support often meant a longer grind.
- Price caps can mute inflation readings, while pushing costs into public finances.
- Targeted support tends to cost less than broad subsidies, but it’s harder to run well.
- Temporary fixes sometimes turned semi-permanent. That’s where the bill grows.
Import dependence and market design
Not every country buys energy the same way. Some rely heavily on imported gas, oil, or coal. Others lean on domestic production, long-term contracts, or regulated tariffs. Those choices shaped who took the hit first — and who kept taking it.
Markets that set electricity prices using marginal generation can swing wildly when gas spikes. It’s a design choice. In a crisis, it can feel brutal.
- High import reliance tends to amplify volatility, especially without storage buffers.
- Gas-linked electricity pricing can transmit fuel shocks straight into power bills.
- Long-term contracts may smooth prices, but can lag when global prices fall.
Households: who got squeezed the most
A 10% jump in energy costs does not feel the same everywhere. Lower-income households often spend a larger share on electricity, cooking fuel, and transport. So the same price move can be a nuisance for one group and a proper crisis for another.
Safety nets help. Efficient housing helps too. Where those are missing, the squeeze shows up fast and loud.
- Energy is a larger budget line for lower-income households, so pass-through hits harder.
- Renters can’t easily upgrade insulation or heating — they’re stuck with the building.
- Targeted aid reduces hardship, but misses happen. Always.
Transport and food: the fast spillovers
Energy shocks don’t stay in one category. Fuel prices feed into logistics. Electricity prices nudge processing and refrigeration. Fertilizer costs (often gas-linked) ripple into farm inputs. Put it together and you get a chain reaction that lands on grocery receipts.
Some links are direct. Some are delayed. Either way, it stacks.
- Freight and commuting costs react quickly to oil and fuel price moves.
- Food prices can lag, but the pressure can persist via inputs and supply chains.
- Countries with higher transport intensity often see larger second-round effects.
Who was hit hardest — and who wasn’t
Countries with high import exposure, gas-linked power pricing, and limited fiscal space tended to feel the sharpest squeeze. Others absorbed the shock more quietly, either by design or by luck.
No one is immune. But structure matters, and so does speed.
- Heavily exposed importers saw larger and longer household impacts.
- Domestic supply and diversified mixes reduced volatility.
- Fast response softened the peak, even if costs arrived later.
Is the pressure really over?
Spot energy prices have eased in many places, but the story isn’t finished. Contracts reset slowly. Grid costs take time to show up. And households remember higher bills long after charts roll over.
The transition itself also carries costs. New infrastructure and resilience don’t come free — though they can reduce future shocks.
- Delayed pass-through keeps pressure alive even as spot prices fall.
- Transition spending can lift bills short term, lower risk long term.
What this episode taught policymakers
This was a stress test for policy design. The countries that came through best tended to combine diversified supply, clearer market rules, and targeted support that didn’t explode budgets.
Not perfect. Just less fragile.
- Diversification reduces exposure, but takes years to build.
- Targeted relief costs less than blanket subsidies.
- Clear price signals matter — even when they’re unpopular.
Frequently asked questions
1) Why did energy prices spike after 2020?
Demand rebounded while supply stayed tight, and gas markets amplified the swing.
2) Did all countries experience the same increase?
No. Import dependence, market rules, and policy choices drove big differences.
3) Why did electricity prices rise with gas?
In many systems, gas sets the marginal price for power generation.
4) How did this affect food prices?
Energy feeds into transport, processing, refrigeration, and fertilizer inputs.
5) Did subsidies lower inflation?
Often yes on paper, but they shifted costs into budgets or future price resets.
6) Who suffered most at the household level?
Lower-income households, renters, and people in inefficient housing.
7) Are bills back to pre-2020 levels?
Not everywhere. Many places remain above earlier baselines even after easing.
8) Will the energy transition raise bills?
It can in the short term; resilience may reduce future shocks over time.
9) What policies worked best?
Targeted aid, diversification, and clear market rules with predictable support.
10) What’s the key lesson?
Structural exposure matters more than headlines when shocks hit.
Hashtags
#EnergyPrices #CostOfLiving #Inflation #ElectricityPrices #GasPrices #EnergyMarkets #HouseholdBudgets #EnergyPolicy #GlobalEconomy #LivingCosts #EnergySecurity #EnergyTransition
Sources
- IEA — International Energy Agency datasets
- World Bank — Energy & inflation indicators
- IMF — Inflation and macro data
- OECD — Energy price & policy trackers
- Our World in Data — Energy and emissions charts
- UNCTAD — Trade and price pressures

Discover more from ThePolymathPursuit
Subscribe to get the latest posts sent to your email.
Yo, just checked out f1688. Pretty smooth site, gotta say. Need to dig deeper but so far, so good. Check it out f1688!
Trying out casinomhub142, wish me luck and hope i win something while trying it out!! casinomhub142
Seriously questioning if is 777pub legit because the offers seem too good to be true. Red flags or am I just being paranoid? Has anyone had any successes or problems? I heard that they are a growing company, go to their source here: is 777pub legit
Yo, checking out jljl999! It’s got that classic vibe, you know? Could be a good spot to unwind after a long day. Have a look-see: jljl999
Alright, just gave 6886winbet a whirl. Seems legit! The games are fun and the bonuses seem decent. Hoping my luck holds out! Give it a try if you’re feeling lucky: 6886winbet
Hey, checking out 55bmwslot and so far, so good! The site’s pretty smooth and easy to navigate. Fingers crossed for some big wins! Check it out for yourself here: 55bmwslot
Fun88mx1 is pretty decent! The interface is clean, and I like the variety of games they offer. Check out fun88mx1 if you’re looking for something new.
Yo, RS999 is legit! Been playing here for a while and the payouts are quick. Give rs999 a shot, you might just get lucky!
Looking for some fun? MX Fun seems like an interesting platform to explore. I’ll check it out and see if it lives up to its name! Have some mx fun: mx fun