Discover how American life expectancy climbed impressively from the 1990s into the 2000s, then plateaued and even dipped by 2020. We’ll unpack the bar chart’s color-coded story, explore widening state gaps, and suggest policy levers that could help close the divide.
Despite three decades of overall gains, U.S. life expentancy improvements weren’t uniform: most states saw steady rises from 1990 through 2010 but then stalled—and many reversed—by 2020 amid the opioid crisis and COVID-19. The bar chart shows steep increases in places like Hawaii and Minnesota early on, only to flatten later, while states such as Mississippi and West Virginia seldom kept pace. By 2020, Hawaii topped at about 80.7 years and Mississippi trailed near 72—a gap of nearly nine years that maby many dont fully appreciate.
Table of Contents
Introduction
Over the past 30 years, advances in medicine, public health initiatives, and socio-economic improvements helped push U.S. life expectancy upward—from around the mid-70s in 1990 to nearly 79 years by 2010. Yet those gains plateaued after 2010, and life expectancy edged downward into the early 2020s, marking the first sustained decline in decades. These national averages mask deep divides between states—a story our bar chart makes vividly clear.
Explaining the Bar Chart
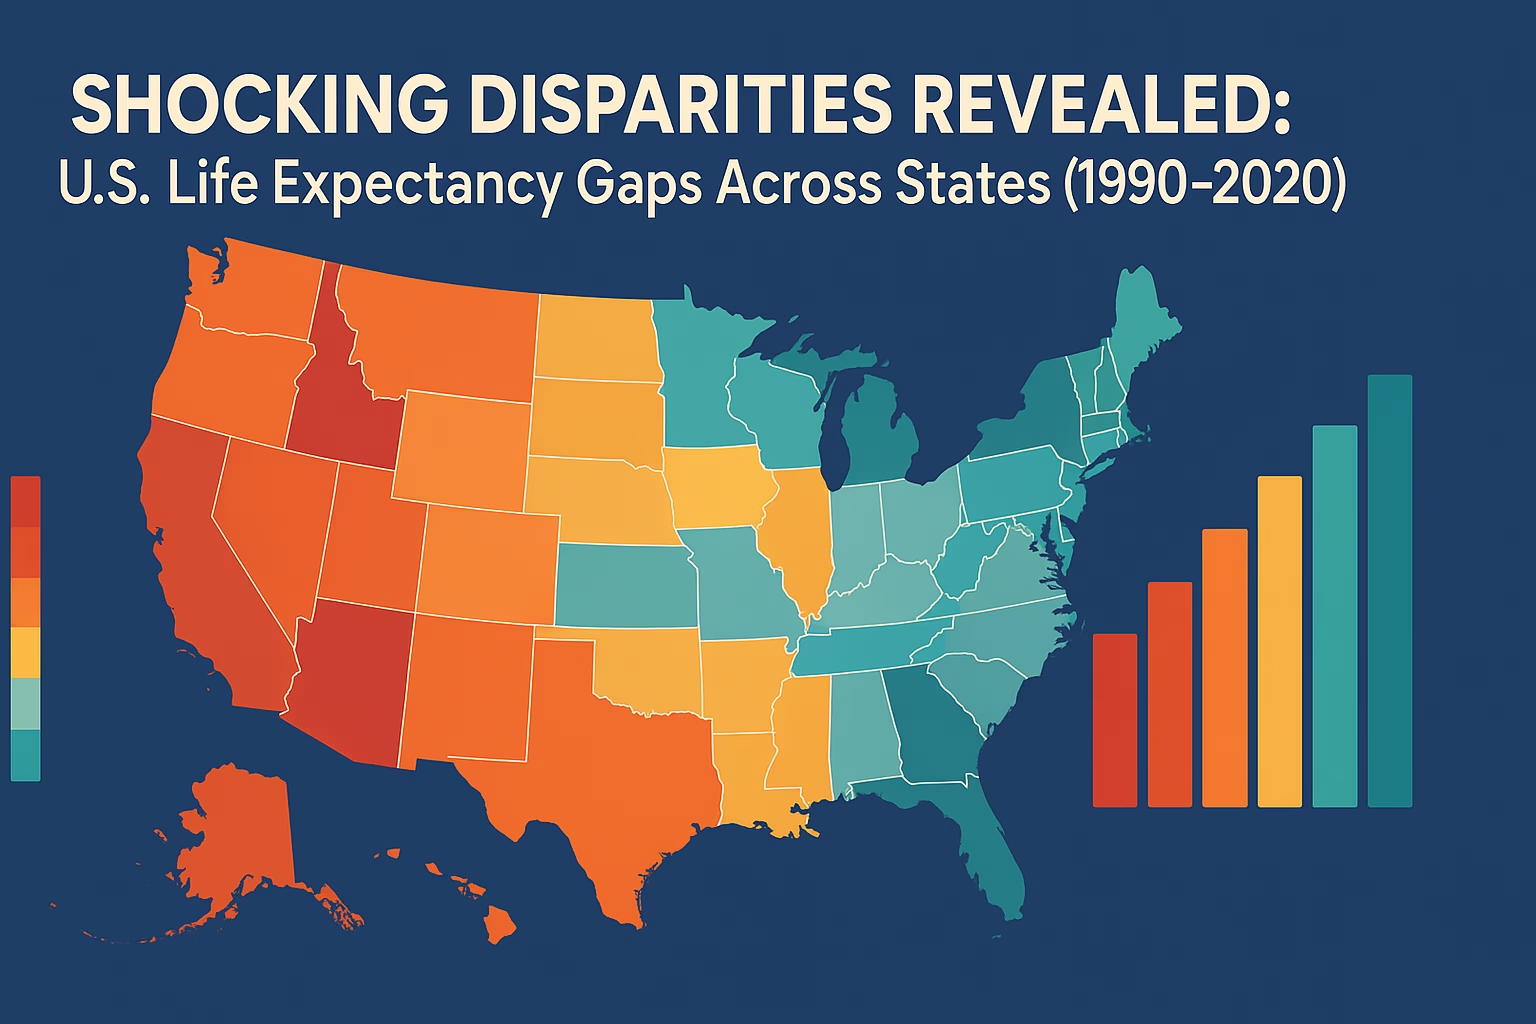
The chart lines up life expectancy at birth for all 50 states plus D.C., comparing four snapshots: 1990, 2000, 2010, and 2020 cdc.gov. Each state is color-coded consistently across years, so you can easily track how, say, California (light gray) moved from ~75.9 in 1990 to ~80.8 by 2010, then dipped to ~79.0 in 2020.
You’ll notice Hawaii (wheat) surged early—from about 78.2 in 1990 to 81.3 in 2010—before a slight retreat to 80.7 in 2020, retaining its top-rank status. In contrast, Mississippi (pale olive) lingered near 73 in 1990, climbed to only 75.0 by 2010, then fell back to around 71.9 by 2020, anchoring the bottom of the list.
That “flatten-and-dip” pattern appears in many Appalachian and Southern states—West Virginia, Alabama, and Louisiana—while much of the Northeast and West Coast show steadier gains. The chart’s horizontal bars and aligned axes make it easy to compare across years and spot where progress has stalled.
Evolution of Trends (1990–2020)
1990s: Steady Gains
- Medical breakthroughs (e.g., better heart disease treatments) and widespread tobacco-cessation efforts fueled roughly 0.2-0.3 years of life expectancy gain per calendar year during the 1990s.
- Most states saw increases of 2–4 years over the decade, with leaders like Colorado and Minnesota climbing fastest.
2000s: Continued Climb
- The early 2000s continued the upward march, driven by improved chronic disease management and reduced infant mortality.
- By 2010, the national high hovered around 81 years (Hawaii), and even lagging states had crossed 75 on average.
2010–2020: Plateau and Reversal
- From 2014 onward, “deaths of despair” (overdoses, suicides, alcohol-related diseases) began to offset earlier gains.
- The opioid epidemic alone cut nearly a year off national life expectancy by 2020.
- COVID-19 accounted for an additional sharp drop in 2020, pulling averages down across nearly every state.
State Disparities and Regional Patterns
Top Performers
- Hawaii: ~80.7 years in 2020, highest nationwide .
- California & Connecticut: Consistently in the top five, thanks to robust healthcare systems and preventive programs.
Bottom Tier
- Mississippi: ~71.9 years in 2020, lowest of all states.
- West Virginia & Louisiana: Struggled with substance abuse, poverty, and limited healthcare access.
Widening Gaps
- The nearly nine-year gap between the highest and lowest life expectancies in 2020 underscores persistent inequities in socio-economic factors, healthcare access, and public health policies.
Key Drivers Behind the Trends
Healthcare Access & Medicaid Expansion
- States that expanded Medicaid under the ACA saw roughly a 6.1% drop in all-cause mortality, equating to nearly 20 lives saved per 100,000 adults annually.
- Conversely, non-expansion states experienced smaller gains and larger reversals, especially in rural and low-income regions.
Deaths of Despair
- Drug overdoses, suicides, and alcohol-related diseases surged after 2014, particularly in the Ohio Valley and New England, dragging national life expectancy down.
- Opioid-related deaths alone accounted for an eight-month reduction in average life expectancy by 2020.
Social Determinants & COVID-19
- Factors like poverty, education gap, and housing insecurity correlate strongly with lower life expectancy.
- The COVID-19 pandemic disproportionately impacted older adults and communities with limited healthcare infrastructure, causing a sharp, across-the-board decline in 2020.
Policy Recommendations
- Broaden Medicaid & Insurance Coverage. Expanding eligibility can save tens of thousands of lives through better preventive care.
- Tackle Substance Abuse. Increase funding for addiction treatment, naloxone distribution, and mental health services to curb overdoses.
- Invest in Social Safety Nets. Address poverty, food insecurity, and education as fundamental health interventions.
- Enhance Public Health Campaigns. Promote vaccinations, screenings, and healthy behaviors, especially in lagging regions.
Conclusion
The U.S. chart of state life expectancies from 1990 to 2020 tells a tale of hope turned cautious: early gains gave way to troubling plateaus and reversals. State-level disparities—driven by healthcare access, substance abuse, and socio-economic factors—highlight where policy action is most needed. By expanding coverage, bolstering social supports, and targeting public health crises head-on, we can aim to close the nearly nine-year gap and restore upward momentum.
FAQs
Q1: Why did life expectancy stall after 2010?
Rising “deaths of despair” (overdoses, suicides) and the opioid epidemic began erasing earlier gains by mid-2010s.
Q2: How much did COVID-19 impact 2020 numbers?
COVID-19 accounted for a large share of the one-year drop in life expectancy between 2019 and 2020.
Q3: What states improved the most between 1990 and 2010?
Q4: Which policy has the biggest immediate effect?
Medicaid expansion under the ACA correlates with a 6%+ reduction in adult mortality in expansion states.
#LifeExpectancy #HealthEquity #PublicHealth #MedicaidWorks #EndDeathsOfDespair #StateHealth #PolicyForLife
Follow for more :
ThePolyMathPursuit
If you Like New York Crossword puzzles, Check out :
NYT Mini Crossword

Discover more from ThePolymathPursuit
Subscribe to get the latest posts sent to your email.
Phnicecasino is great, I would definately say that its one of the better casinos because theres a lot of offers. The bonus offers are pretty good so that’s why I like it. phnicecasino
Phil168vip offers top-notch games and services. They provide a VIP experience from start to finish and is a great option for those looking for a real casino experience. phil168vip
PHGolden’s been good to me so far! The layout is clean, and the games are pretty exciting. I was able to win some decent cash! I would recommend giving PHGolden a shot. phgolden
How are you?
unlocker.ai – The Ultimate AI Tool for Bypassing Restrictions and Unlocking Content Seamlessly!
It’s concerning to see how life expectancy plateaued and even declined recently, especially with the widening gaps between states as the article highlights.